Skyline 2015 oyster seed experiment
07/03/17
I will be getting back into Skyline to analyze 2015 oyster seed experiment results.
I had to redownload the program and did so here: https://skyline.ms/project/home/software/Skyline/begin.view
I downloaded the version 3.7- 64bit
Since I had already done some work on this project back in October I am picking up where I left off.
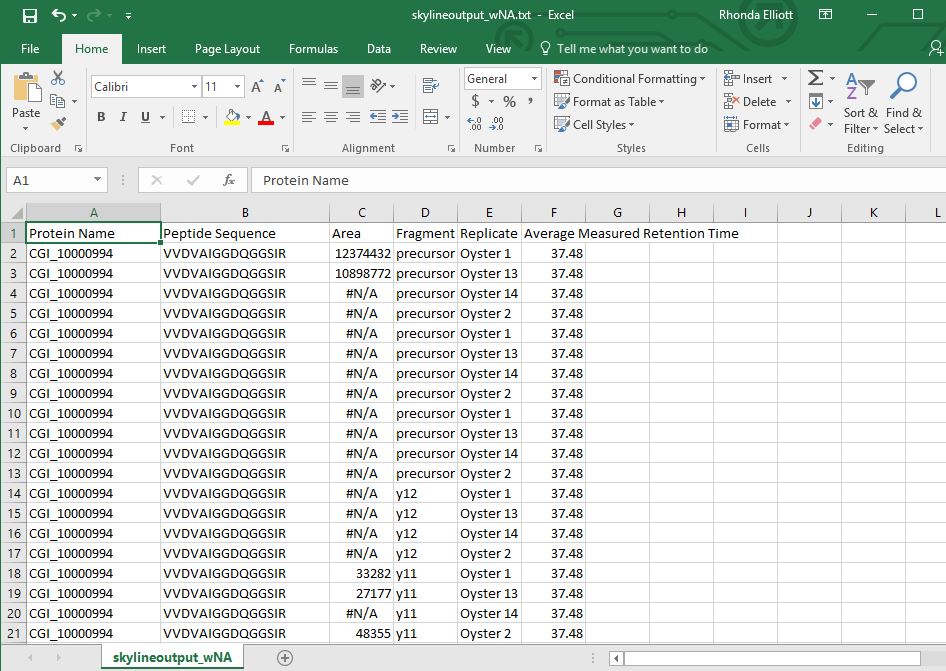
Here is my skyline output file from before. It contains CGI_… codes.
Here is what the file looks before modification:
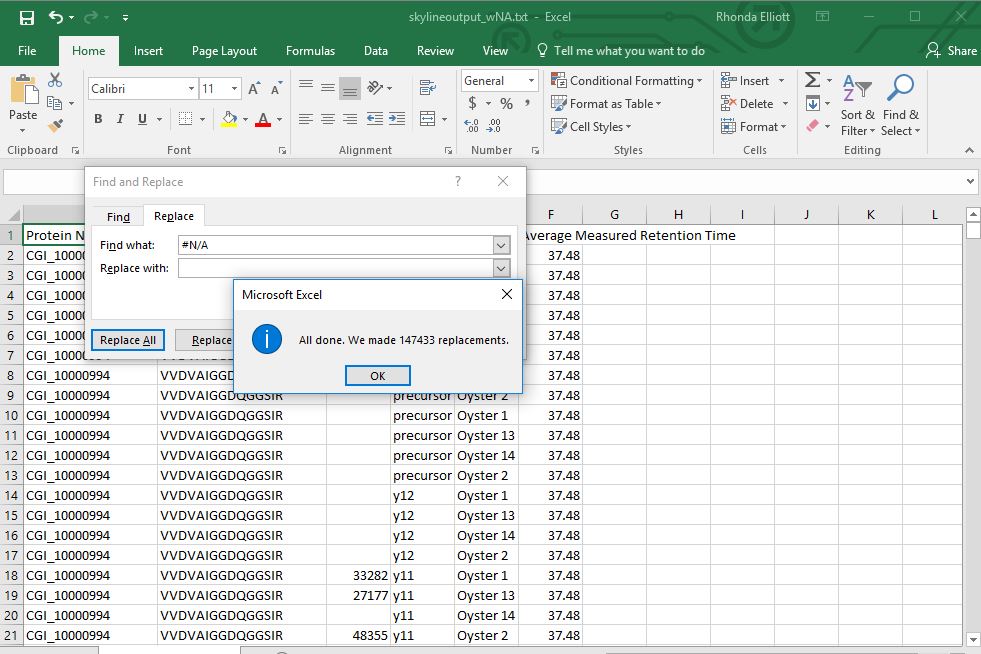
First I removed all of the #N/A and replaced with blanks.
Then I created a Pivot table to sum the peak areas for each protein across all samples
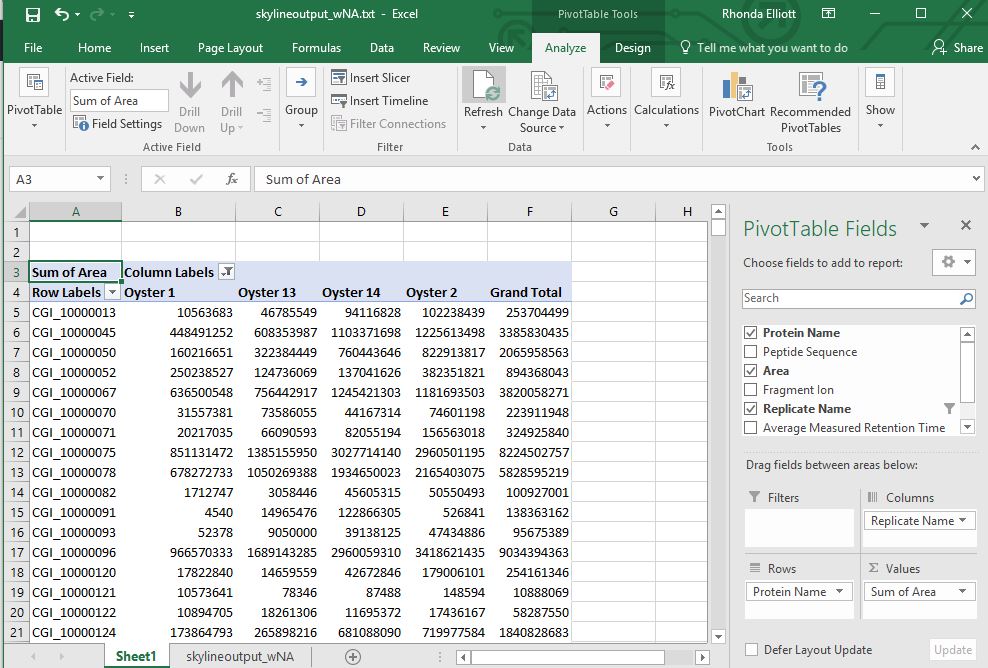
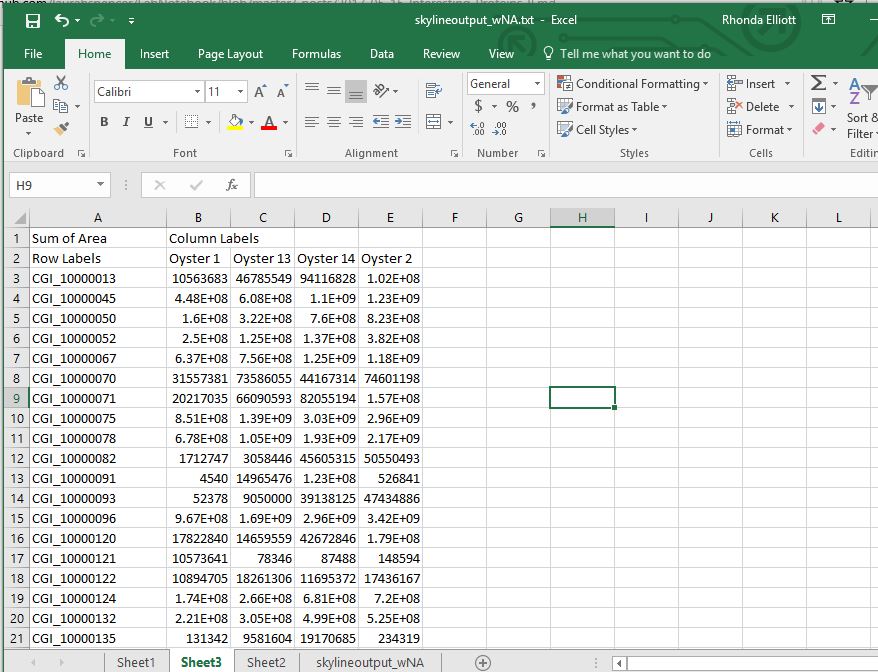
Then I copied and pasted the results from the Pivot table to a new sheet to make it easier to work with.
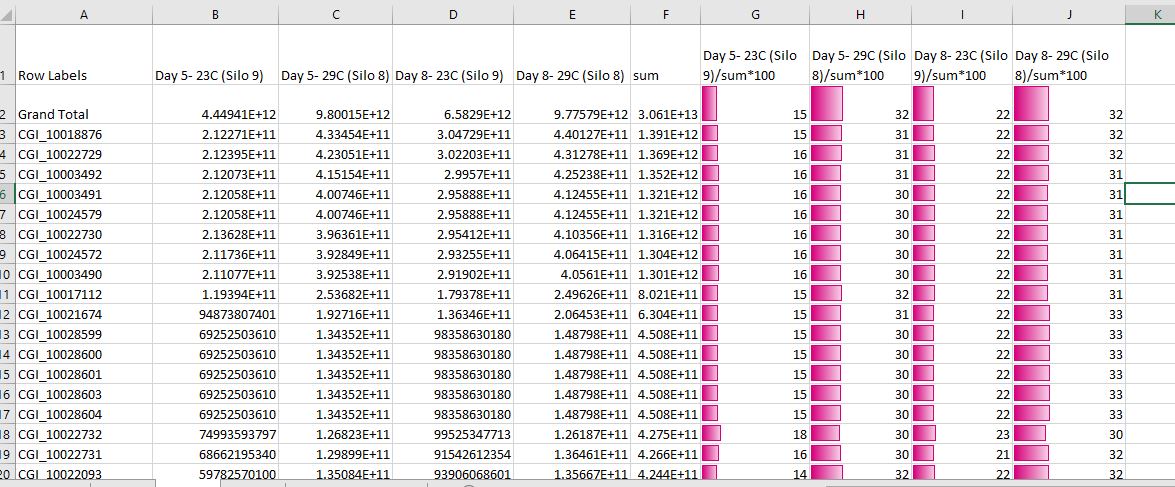
I summed up all the areas for each protein across all samples. To look at the relative abundance of proteins between samples, I created 4 extra columns that calculate the percent contribution each sample has to that protein. For example, for Oyster sample 1, I took the Oyster 1 summed area and divided it by the total summed area across all samples and muliplied by 100. I also relabeled the oyster sample #’s with their identification from the experiment.
Finally I sorted the file by summed area column for all samples largest to smallest to orient the most abundant proteins towards the top of the file.
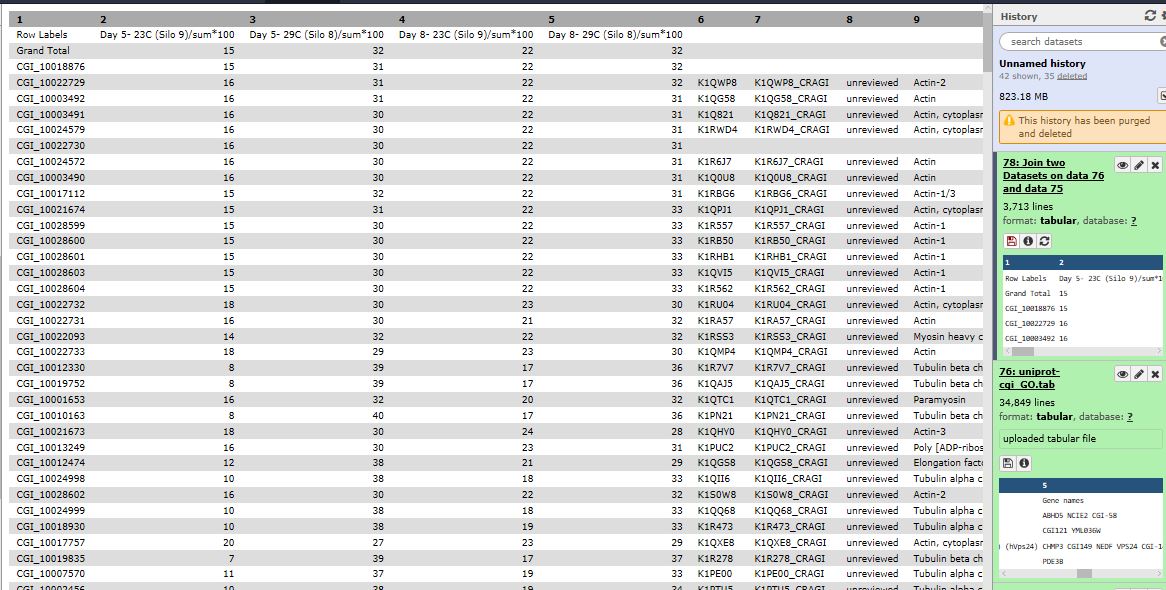
I copied and pasted these calculated percentages for each protein into a new file located here.
I joined it with Uniprot database with CGI codes and GO terms in Galaxy.
Here is the annotated Excel file with all of the proteins detected among the four samples with corresponding GO terms.
I tried unfolding these GO terms in Galaxy but it appears their unfold function is not working. I posted an issue #654 on Github and Sam wrote up a bash script for me to use on this file. I followed the directions he wrote up.
Here is my unfold script.
This was my input file AnnotatedproteinsGO.tabular and here was my output file unfolded.tab
Hooray!
In this step outlined above I had used a file where I had calculated the percent contribution of each sample to that protein. In these steps below, I repeat what I did above except I am using a file with the raw values for the “area” that I had gotten out of Skyline here: https://github.com/RobertsLab/project-pacific.oyster-larvae/blob/master/DIA_2015/skylineoutput_wNA.xlsx
I followed the same steps above to unfold the GO column and then I merged with the GOtoGOslim file in Galaxy similar to what I did when analyzing the 2016 data found here: https://ellior2.github.io/GoSlimRedone/
Here is the excel file I am working with now.
Then I created a Pivot table to sum the areas:
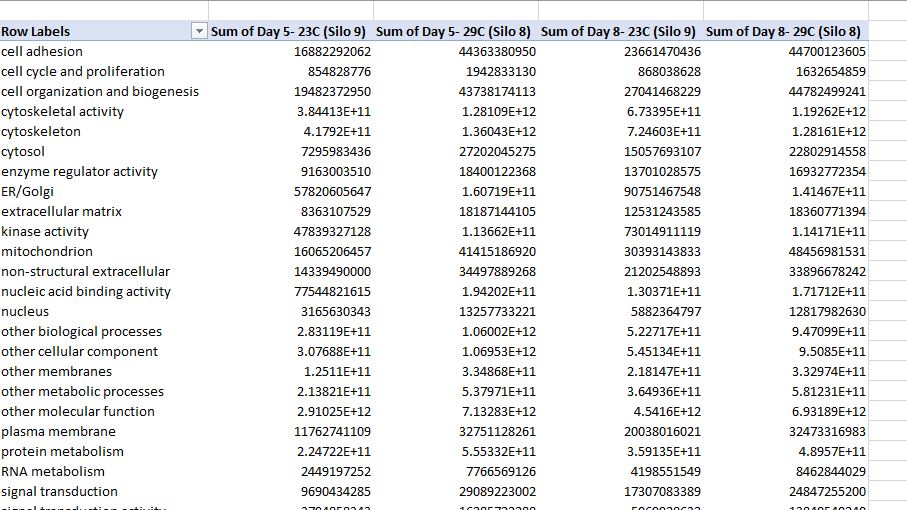
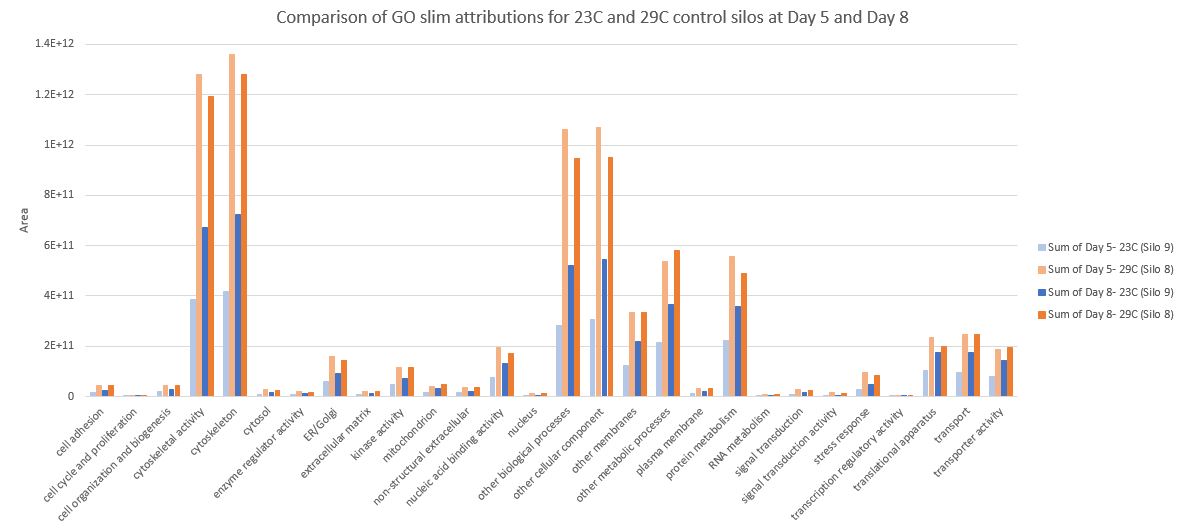
Here is a graph showing the GO slims for each of the four samples:
Goslim 2015
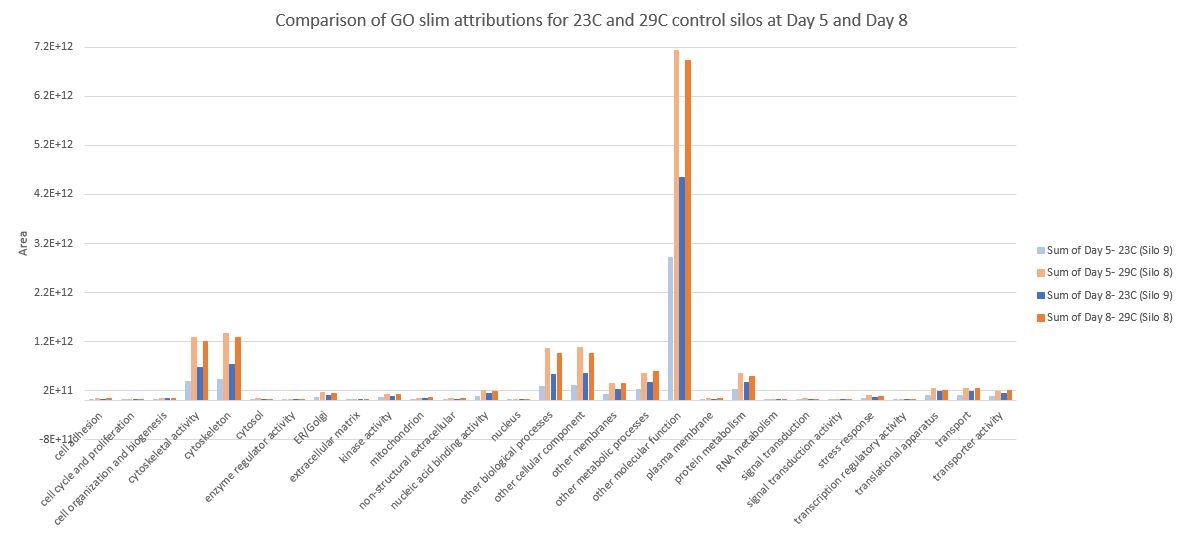
Since the other molecular function category has a much greater range making it difficult to see the other categories, I removed it in this graph.
Goslim 2015 remove molecular function