What happened at Day 9?
04/30/2017
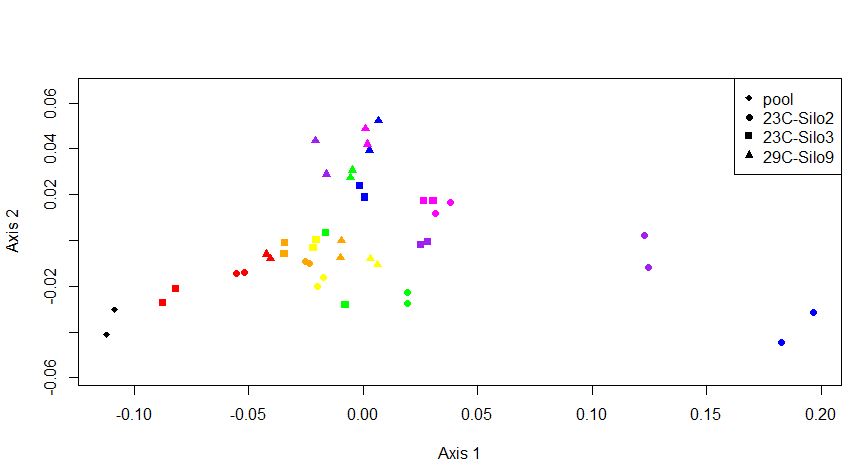 Day 1: Black, Day 3: Red, Day 5: Orange, Day 7: Yellow, Day 9: Green, Day 11: Blue, Day 13: Purple, Day 15: Magenta
In the NMDS plot we noticed a divergence occuring at Day 9 between all of the silos. Here I compared Sample 27 (Silo 2-23C at Day 9) with 32 (Silo 9-29C at Day 9). See table
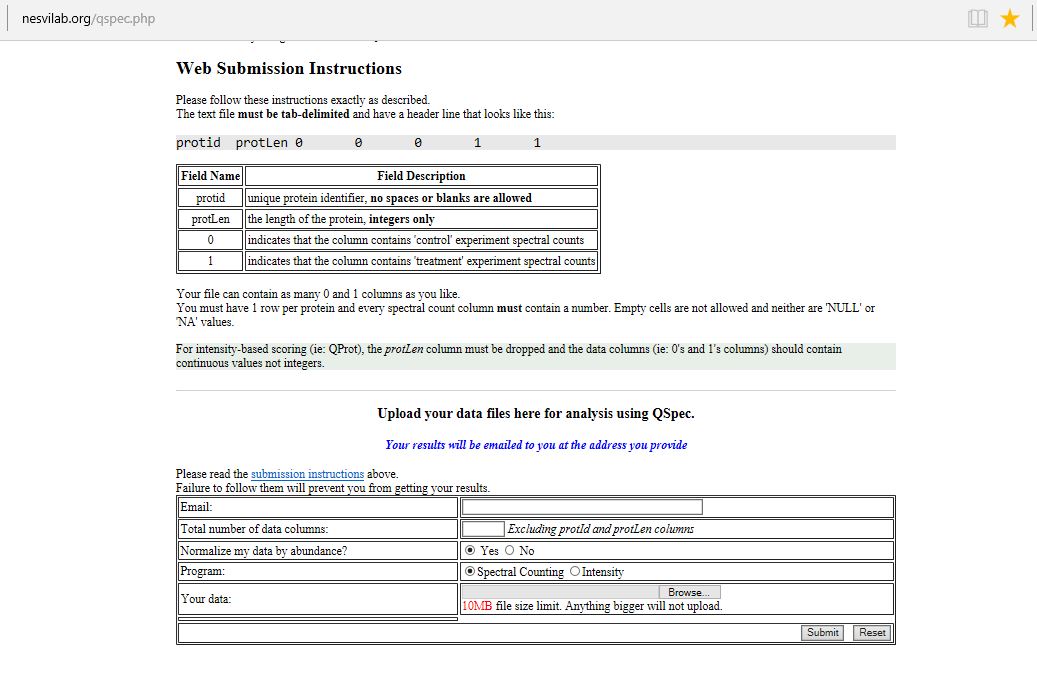
I used Qspec to calculate statistics:
-
First using Qspec I calculated statistics associated with differential protein expression between Silo 2-23C and Silo 9-29C at Day 9. Here is the file
-
You will get an output with Z statistics and log fold change values. You want to consider all proteins with a Z-statistic with absolute value of at least 2 and a log fold change with an absolute value of at least 0.5.
-
Next you will annotate this file by joining (I like to use Galaxy). Here is the file I used to join with my output file from Qspec.
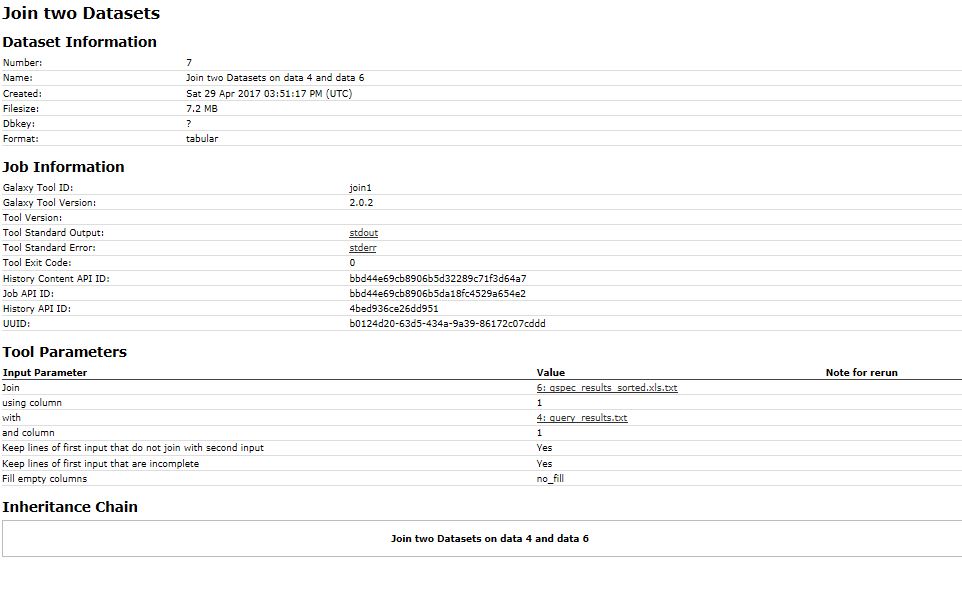
-
After annotation I sorted the file using true values. The negative values represent highly expressed proteins in your “0” treatment- or your first column in the file you uploaded to Qspec. The positive values represent highly expressed proteins in your “1” treatment- or second column.
-
Then I seperated the file into two files- one with proteins highly expressed in my Silo 2-23C and one with proteins highly expressed in Silo 9-29C.
-
Now for each file, I sorted to remove any proteins that did not fit the statistical criteria described above.
-
I uploaded these two files in Galaxy and unfolded the GO column.
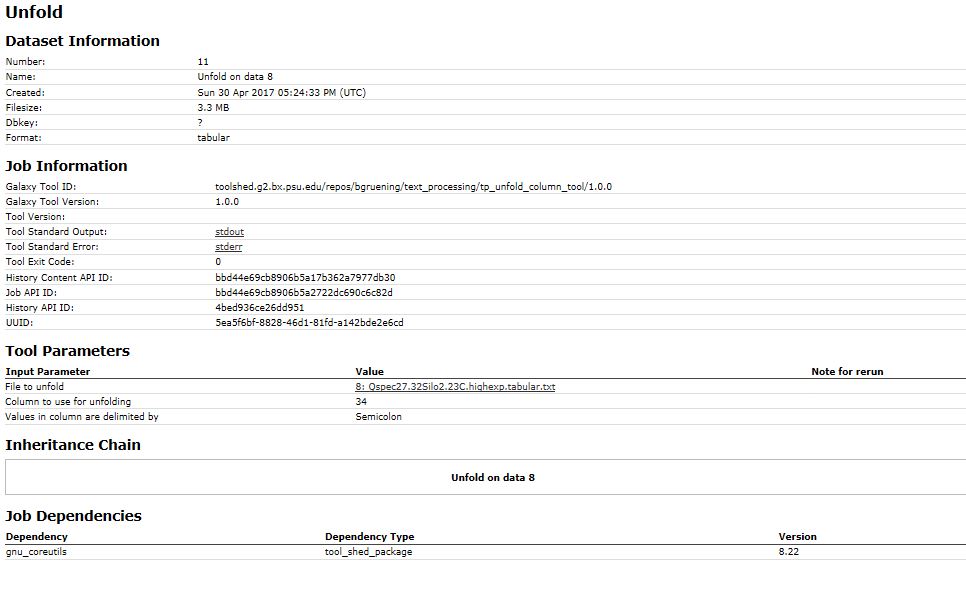
- Here are my two files:
-
Next I copied and pasted the GO terms and the associated Z-statistic to a new sheet. There were some proteins that were not annotated and so I deleted if there was no GO term associated with it for the Revigo analysis.
-
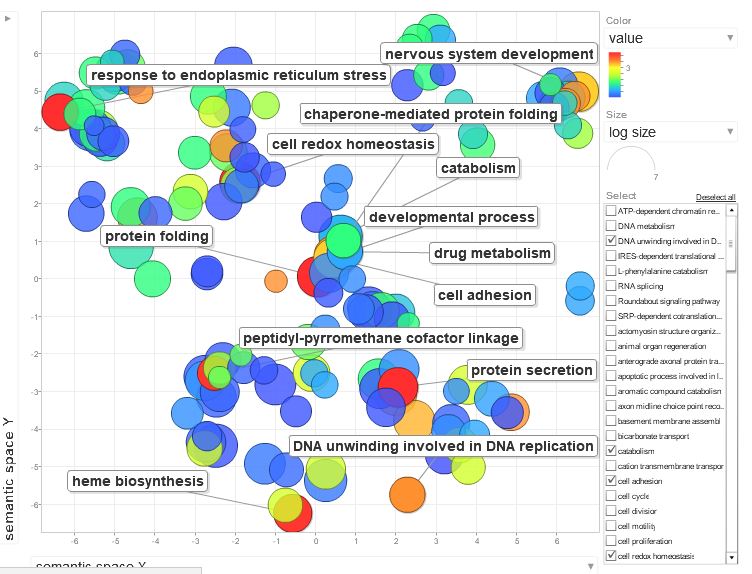
Here are the Revigo visualizations
Silo 2-23C Highly expressed proteins
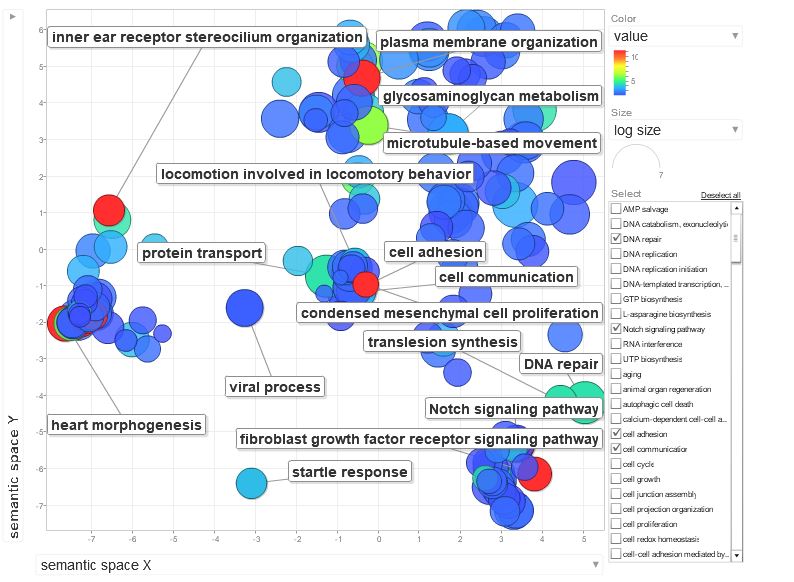
Silo 9-29C Highly expressed proteins